Twitter Analytics in 2026: The Complete Guide to Measuring What Actually Grows Your Account
How to access X analytics (free and Premium), the metrics that matter, and the numbers you should stop obsessing over.
If you’re posting on X (formerly Twitter) and can’t answer the question “is this actually working?” — this guide is for you.
Twitter analytics is the difference between throwing content at the timeline and knowing exactly which posts earn attention, which formats your audience actually wants, and which days are worth logging in for. The catch: since X rebranded, analytics access has changed. The full dashboard now sits behind a Premium subscription, and most guides online still reference the old free dashboard.
This guide covers what you can see for free, what you can’t, and — more importantly — how to read the numbers you do get without falling into the trap of tracking metrics that don’t translate to growth.
What is Twitter analytics?
Twitter analytics (now officially X analytics) is the platform’s built-in performance dashboard. It tracks how your posts perform and how your audience behaves — impressions, engagement rate, profile visits, follower growth, link clicks, video performance, and audience demographics.
There are really three layers of analytics available on X today:
- Basic per-post counts — likes, replies, reposts, bookmarks, and views. Visible to everyone, directly under every post.
- Post-level analytics on mobile — tap any of your posts in the X mobile app and you’ll see impressions, engagements, and engagement rate for that specific post. Free, but one post at a time.
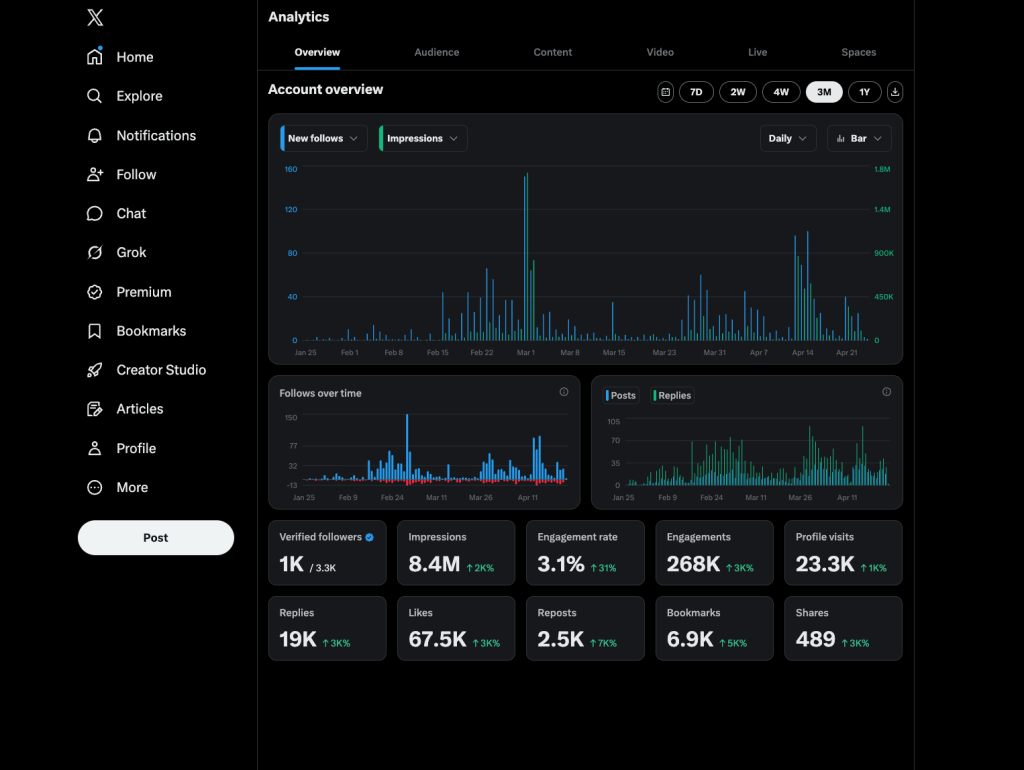
- The full account dashboard — the long view. Impressions over 28 days, top posts, audience demographics, follower growth trends, profile visits. This is the one that now requires X Premium on desktop.
If you’re serious about growing, you’ll want at least the second layer. Whether you pay for the third depends on how much you value historical data and trend analysis — more on that below.
How to access Twitter analytics (free and Premium)
Option 1: Post-level analytics on mobile (free)
This is the workaround most creators don’t know about. Even without Premium:
- Open the X mobile app.
- Go to your profile and tap any of your own posts.
- Tap “View post analytics” at the bottom of the post.
You’ll see impressions, engagements, engagement rate, profile visits from that post, new follows, and link clicks. You can do this for any post you’ve published, going back indefinitely. It’s slow if you’re analyzing dozens of posts — but it’s free.
Option 2: Basic engagement counts (free, on every platform)
On any post you publish, the row of icons at the bottom shows likes, replies, reposts, and views. Tap the view count and you’ll see a breakdown that includes bookmarks. This is the fastest gut-check — if a post has a high view count but almost no engagement, it’s a signal the content didn’t land, even if it “reached” people.
Option 3: The full analytics dashboard (requires X Premium)
To get the full account-level dashboard with 28-day trends, top posts, audience insights, and follower analytics, you need an active X Premium subscription. Here’s how to access it once you’re subscribed:
- Go directly to
x.com/i/account_analyticsand log in. - Or, from the desktop sidebar on x.com, click the three dots (More) → Creator Studio → Analytics.
X Premium currently starts at $8/month for the standard tier. Basic tier ($3/month) also unlocks some analytics features as of early 2026, though the full dashboard is tied to the $8 tier and up.
Option 4: Third-party analytics tools
If you don’t want to pay X directly, or you want deeper insights than the native dashboard provides — competitor tracking, historical exports, sentiment analysis, who engaged with you, topic performance — a third-party tool is the other path. We cover the tradeoffs in the analytics tools section below.
The Twitter analytics metrics that actually matter
Most guides list every metric the dashboard shows you. That’s a trap — half those numbers don’t map to growth. Here’s the honest breakdown: the ones worth tracking, the ones worth glancing at, and the ones to ignore.
The metrics worth tracking every week
Impressions. How many times your posts showed up on someone’s screen. This is your top-of-funnel number. If impressions are flat or falling week-over-week, nothing else matters — you have a reach problem to solve before you worry about anything else.
Engagement rate. Engagements divided by impressions, expressed as a percentage. A healthy engagement rate on X sits somewhere between 1% and 3% for most accounts; above 3% is strong, above 5% is excellent. This number tells you whether the people seeing your content actually care. A post with 50,000 impressions and 0.2% engagement got served to the wrong audience. A post with 3,000 impressions and 4% engagement is working — you just need to find a way to amplify it.
Profile visits. Every follow starts with a profile visit. If people click through to your profile but don’t follow, your bio or pinned post isn’t converting. If they don’t click at all, your posts aren’t making them curious enough about who you are.
New followers (net). Follows minus unfollows. Chase net follower growth, not gross. An account that gains 200 followers and loses 180 is treading water — the content is polarizing or off-brand.
Link clicks. Only relevant if your goal is driving traffic off-platform (to a newsletter, a site, a product). If it is, click-through rate matters more than raw impressions.
Metrics worth a glance, not a weekly ritual
Likes, replies, reposts individually. These roll up into engagement rate. Looking at them individually is useful for understanding what kind of engagement you’re earning — replies signal conversation, reposts signal amplification — but tracking them in isolation is busywork.
Video views and completion rate. Only matters if video is a core format for you. If it is, completion rate is the metric — views count after 2 seconds and are basically meaningless.
Mentions. Useful for brand monitoring, less useful for growth. Track spikes, ignore the daily number.
Metrics to ignore
Follower count as a standalone vanity metric. A 50,000-follower account with 2% engagement is healthier than a 500,000-follower account with 0.1% engagement. Count followers as context, not as your scoreboard.
View count alone. Views inflate easily (a scroll-past counts). Always pair views with engagement rate before drawing any conclusion.
Daily fluctuations in anything. X metrics are noisy day-to-day. Always compare 7-day or 28-day windows; a single bad day means nothing.
How to actually use Twitter analytics to grow
The numbers are worthless if you don’t have a workflow. Here’s one that takes about 20 minutes a week and beats 95% of what most creators do.
Step 1: Find your three best posts from the past 7 days
Sort your recent posts by engagement rate, not impressions. The highest-impression post is often just the one that got lucky in the algorithm — it won’t teach you anything repeatable. Your highest engagement rate posts are the ones where the content actually connected. Those are your signal.
Step 2: Find what they have in common
Look for patterns:
- Was it a specific format? (Thread, single tweet, image post, screenshot, reply)
- Was it a specific topic or angle?
- Was it a specific structure? (Question, contrarian take, list, story, mini-essay)
- Was it posted at a specific time of day or day of the week?
Don’t guess. Write the patterns down. After 3-4 weeks of this, you’ll have a much sharper picture of what your audience wants than any generic “best time to post” blog can give you.
Step 3: Find your worst post of the week
The one with the lowest engagement rate. Ask yourself honestly: did it deserve to do better, or was the audience right to ignore it? Most of the time, your worst posts are the ones where you were either playing it safe, posting filler, or writing for yourself instead of for the reader. Cut that kind of content next week.
Step 4: Run one experiment per week
Based on what’s working, try one new variation. If your image posts are outperforming text-only, commit to one image post per day next week and measure. If your threads beat your single tweets, publish two threads next week and compare. One variable at a time.
This is boring. It’s also how every account you admire actually grew.
The best Twitter analytics tools in 2026
If the native dashboard isn’t enough — or you don’t want to pay for Premium — here are the main options. None of these are perfect; each trades something for something else.
Hootsuite and Sprout Social. Enterprise-grade, multi-platform. Best if you’re managing X alongside Instagram, LinkedIn, TikTok, and Facebook. Overkill (and expensive) if X is your only channel.
Buffer. Lighter and cheaper than the enterprise options. Good for scheduling plus basic historical analytics. Engagement rate breakdowns are shallower than what you’d get from a dedicated X tool.
Fedica, Brand24, Minter, Metricool. The X-first tier. These go deeper on X-specific analytics — follower demographics, topic performance, who engaged with you — and most offer free tiers that are usable for solo creators.
TweetRanking. Purpose-built for creators who want to know exactly how their tweets compare to others in their niche, see what’s working across their category, and benchmark without guessing. If your goal is ranking, not just tracking, this is what we do.
The honest advice: don’t pay for any tool until you’ve been consistent on X for at least 60 days. Until then, free mobile analytics plus a spreadsheet where you log your top three posts each week will teach you more than any dashboard.
Twitter analytics FAQ
Is Twitter analytics free? Partially. Basic per-post engagement counts and mobile post-level analytics are free for everyone. The full account-level dashboard with 28-day trends, demographics, and historical data now requires X Premium starting at $8/month.
Why can’t I see my Twitter analytics? Three common reasons: (1) you’re trying to access the full dashboard without a Premium subscription — switch to mobile post-level analytics instead; (2) you’re logged in on an incompatible device — the full dashboard is desktop-only; (3) your account is too new and hasn’t accumulated data yet. The dashboard needs activity to populate.
What’s a good engagement rate on Twitter? For most accounts, 1–3% is healthy, 3–5% is strong, and above 5% is excellent. Smaller accounts often see higher engagement rates because engagement distributes unevenly — a 500-follower account can easily hit 10% on a good post. Engagement rate tends to compress as accounts grow.
How often is Twitter analytics updated? The native dashboard updates roughly in real time for impressions and engagements, though demographic and aggregate metrics can lag a few hours. Weekly and monthly rollups refresh once per day.
Can I see who viewed my Twitter profile? No. X gives you aggregate profile visit counts, but not the identities of the people who visited. Any tool claiming to show individual profile viewers is either guessing from engagement data or misleading you.
How do I export my Twitter analytics data? The native X dashboard has limited export — you can download CSVs of post performance for a given date range if you’re on Premium. For deeper exports (historical data beyond what X retains, competitor data, filtered exports), you need a third-party tool.
Do I need analytics if I’m just posting for fun? No. Analytics matter when you have a goal — growing an audience, driving traffic, building a brand, landing clients. If posting on X is a hobby, ignore the numbers and just post.
The bottom line
Twitter analytics are more fragmented than they used to be — some data is free, some is paywalled, some sits inside the mobile app where most people never look. But the fragmentation doesn’t matter much if you know which few metrics actually move the needle.
Engagement rate, net follower growth, and a weekly habit of studying your top three posts will outperform any dashboard subscription if you don’t have the discipline to act on what you see. Pay for tools when they save you time, not when they give you more numbers to ignore.
And if you want to see how your tweets stack up against others in your niche — not just your own history — that’s exactly what tweetranking.com was built for.