How to See Twitter Analytics in 2026: Every Way to Access Your Data (Free and Paid)
Five different methods to check your X analytics — on desktop, on mobile, with Premium, without Premium, and through third-party tools. Plus what to do when the dashboard won’t load.
X changed how analytics works. The dashboard you remember from 2022 — free, full-featured, one click from the sidebar — is gone. What replaced it is a split system: some data sits behind a Premium paywall, some is free but tucked into the mobile app, and some requires knowing the right URL to find it at all.
This guide is the complete access reference. If you just want to know where to click to see your numbers, you’re in the right place. (If you want to know what the numbers mean and how to use them to grow, that’s our Twitter analytics pillar guide — this one focuses purely on getting in.)
Quick answer: the 5 ways to see Twitter analytics
Depending on your account type and what you’re trying to see, one of these five methods will work:
| Method | What you see | Requires Premium? | Platform |
|---|---|---|---|
| Full dashboard (direct URL) | Full account-level analytics, 28-day trends, demographics, top posts | Yes | Desktop |
| Full dashboard (sidebar nav) | Same as above | Yes | Desktop |
| Mobile post-level analytics | Impressions, engagements, engagement rate, profile visits per post | No | Mobile app |
| Basic engagement counts | Likes, replies, reposts, views, bookmarks on each post | No | Anywhere |
| Third-party tools | Varies — historical exports, competitor data, audience insights | No (separate pricing) | Anywhere |
Most people need a combination. Here’s each method in detail.
Method 1: The full analytics dashboard via direct URL (Premium required)
This is the fastest way to land in your full dashboard if you have an X Premium subscription.
- Open a browser and go to
x.com/i/account_analytics. - If you’re not logged in, sign in with your X credentials.
- You’ll land directly on the dashboard.
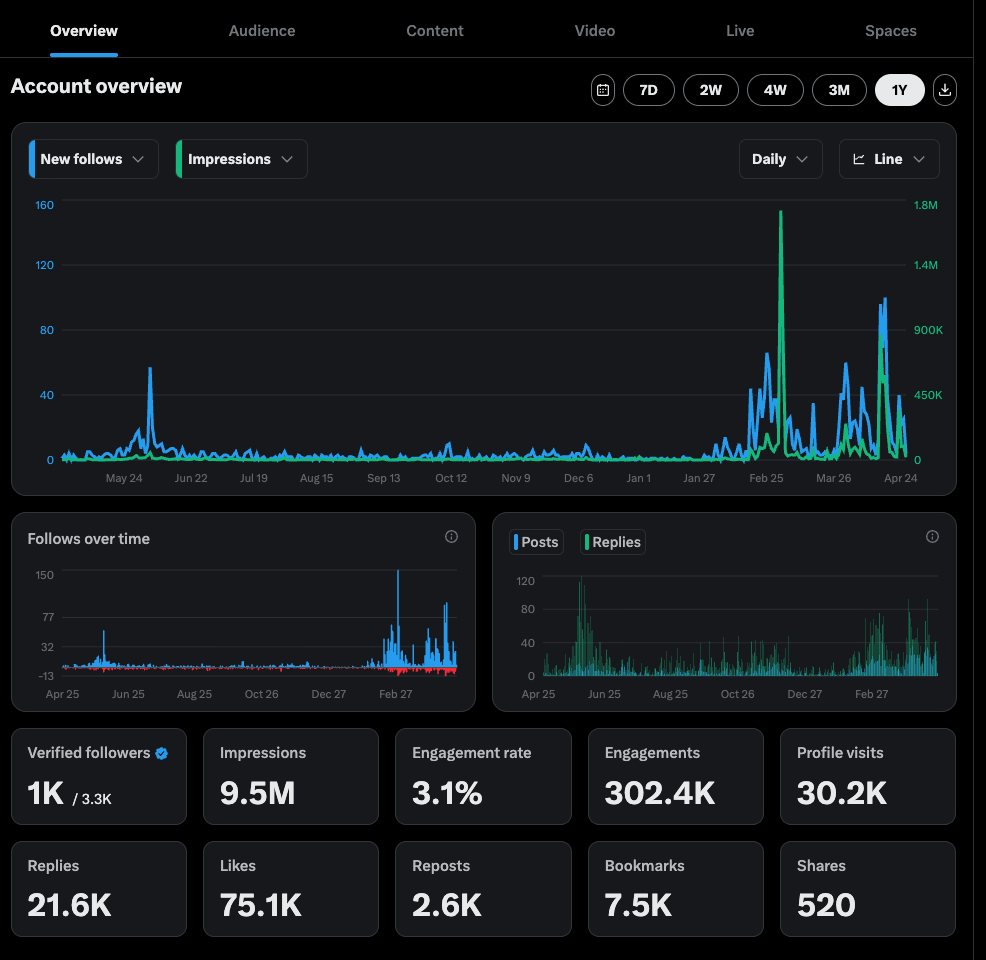
If you have Premium, this opens the full account view — impressions over the past 28 days, engagement rate trends, top posts, audience demographics, and follower growth charts.
If you don’t have Premium, this URL either redirects you to an upgrade page or shows a prompt to subscribe. There’s no free workaround that gets you into this specific view.
Tip: bookmark the URL. It’s the single fastest way in.
Method 2: The full analytics dashboard via the X sidebar (Premium required)
If you prefer clicking through the interface rather than typing URLs:
- Log in to x.com on desktop.
- On the left sidebar, click More (the three-dot icon).
- Click Creator Studio.
- Click Analytics.
You’ll land on the same dashboard as Method 1. Same Premium requirement applies.
Some users see a slightly different menu label — the Creator Studio entry has been renamed a few times since the X rebrand. If you don’t see it, jump straight to Method 1’s URL.
Method 3: Mobile post-level analytics (free, no Premium needed)
This is the method most people don’t know exists, and it’s the single biggest free analytics win available on X today.
- Open the X mobile app (iOS or Android).
- Go to your profile.
- Tap any of your own posts to open it.
- Tap View post analytics at the bottom (it sits just below the like/reply/repost icons).
You’ll see, for that specific post:
- Impressions — how many times the post appeared on someone’s screen
- Engagements — total interactions (likes, replies, reposts, clicks, profile visits, etc.)
- Engagement rate — engagements divided by impressions, expressed as a percentage
- New follows — people who followed you after seeing this post
- Profile visits — how many people clicked through to your profile from this post
- Link clicks — if your post contained a link
- Detail expands — how many people tapped to read more (for longer posts)
You can do this on every post you’ve ever published. No Premium needed, no paywall, no workaround.
The catch: it’s one post at a time. There’s no bulk view, no 28-day summary, no way to export. If you want to analyze 30 posts, you’ll be tapping 30 times.
The workaround: create a simple spreadsheet. Each week, tap through your last 7–10 posts and log impressions and engagement rate in a row. After a month, you have the trend data the Premium dashboard would give you — just built by hand.
Method 4: Basic engagement counts (free, visible everywhere)
The simplest possible analytics are sitting right on every post you publish. Under each of your own tweets, you’ll see:
- Reply count (speech bubble icon)
- Repost count (recycle icon)
- Like count (heart icon)
- View count (bar graph icon)
- Bookmark count (tap the view count to reveal)
These aren’t a substitute for the full dashboard, but they’re enough to spot which posts are outperforming others at a glance. If you’re a casual poster and just want to know which of your tweets are landing, this is probably all the analytics you need.
Important caveat on view counts: views inflate easily. A view counts after roughly 2 seconds on screen, whether or not the person read anything. A high view count with low engagement means the post got served by the algorithm but didn’t connect. Always pair views with engagement rate before drawing conclusions.
Method 5: Third-party analytics tools
If you don’t want to pay X for Premium but you do want deeper analytics than the native free options provide, third-party tools fill the gap. These tools typically connect to your account via X’s API and pull metrics into their own dashboards.
Common options in 2026:
- Buffer, Hootsuite, Sprout Social — general social media management tools with X analytics modules. Good if you manage multiple platforms.
- Fedica, Metricool, Minter, Brand24 — X-focused or X-heavy tools with deeper native platform analytics.
- TweetRanking — specifically for creators who want to benchmark their tweets against their niche, not just their own history.
Each tool has tradeoffs on pricing, data freshness, and which metrics they expose. Most offer free tiers you can start with. For a full comparison of what each does best, see our guide to the best Twitter analytics tools.
Accessing individual tweet analytics on desktop
If you’re on desktop and want per-post analytics without paying for Premium, the easiest workaround is actually to flip to mobile — open the X mobile app and use Method 3. There’s no free desktop equivalent of the mobile “View post analytics” link.
That said, one more option exists: if you have X Ads Manager set up (free to create an account, no campaign required), you can view some tweet-level performance data inside the ads interface. Go to ads.x.com → Analytics → Tweets. This isn’t a full substitute but it’s the best free desktop option.
Troubleshooting: “I can’t see my Twitter analytics”
Four common reasons the dashboard won’t load, in order of likelihood:
1. You don’t have X Premium
This is by far the most common cause today. If you’re trying to access the full dashboard (x.com/i/account_analytics or the sidebar path) without a Premium subscription, you’ll either be redirected to an upgrade page or see a blank/restricted view.
Fix: either subscribe to X Premium ($8/month for the standard tier as of writing), or use Method 3 (mobile post-level) to get the free subset.
2. Your account is too new
Analytics need data to show. If you just created your account or haven’t posted in a while, the dashboard may be empty or display “no data available.” Accounts typically need to have been active for at least 14 days and have published enough posts to generate meaningful metrics.
Fix: post consistently for a couple of weeks, then check back.
3. You’re on a mobile browser, not the mobile app
The mobile browser version of X doesn’t show the View post analytics link that appears in the native iOS and Android apps. If you’re checking analytics on your phone via Safari or Chrome, you won’t see it.
Fix: install the actual X app and use Method 3 there. Or switch to desktop.
4. Your account is flagged or restricted
If your account has been temporarily restricted, shadowbanned, or flagged for policy review, some analytics features can be disabled. This is rare but possible.
Fix: check your account status at x.com/settings/your_twitter_data. If there’s an active restriction, appeals can usually be filed from the same page. Analytics should reappear once any restriction is lifted.
What you can see at each level (quick reference)
If you’re trying to figure out what’s worth paying for, here’s what each access level gives you:
Free (everyone):
- Likes, replies, reposts, views, bookmarks on each post
- Basic per-post impressions and engagement rate (mobile app only)
- Engagement and new-follow data per individual post (mobile app only)
X Premium ($8/month):
- Full account-level dashboard
- 28-day trend charts for impressions, engagement, profile visits, follower growth
- Top-performing posts ranked by impressions and engagement
- Audience demographics (age, gender, location, language, interests)
- Historical data export (CSV)
- Video performance details (completion rate, view rate)
Third-party tools (varies):
- Everything Premium offers, plus:
- Competitor tracking and benchmarking
- Historical data older than X retains
- Bulk exports and custom reporting
- Cross-platform comparisons
- Custom date ranges beyond 28 days
- Content analysis by format, hashtag, topic
How often should you check your Twitter analytics?
Most creators overcheck. Checking your dashboard every few hours is the social-media equivalent of refreshing your email — it feels productive and changes nothing.
A reasonable rhythm:
- Daily: glance at the engagement on your last 1–2 posts. Nothing more.
- Weekly: open the dashboard (or run through your week’s posts on mobile) and identify your top 3 posts by engagement rate. Write down what they had in common.
- Monthly: look at the 28-day trend view. Are impressions growing, flat, or falling? Is net follower growth positive?
That’s the whole loop. Daily micro-checks on individual posts, weekly pattern analysis on top performers, monthly trend review on aggregates. Anything more granular is noise.
FAQ
Is analytics.twitter.com still working? Technically it redirects to analytics.x.com or x.com/i/account_analytics in most regions, though redirects can be inconsistent. Use the current x.com/i/account_analytics URL for reliability.
Can I see Twitter analytics without X Premium? Yes — basic per-post impressions and engagement data are available for free in the X mobile app via View post analytics under each of your posts. The full account-level dashboard requires Premium.
Why can I see analytics on some posts but not others? You can only see analytics on your own posts. Tapping “View post analytics” on someone else’s tweet doesn’t show the same options.
Is there a way to see other people’s Twitter analytics? Not directly — the native dashboard is private to each account. Some third-party tools (Brand24, Fedica, etc.) offer competitor tracking that estimates engagement and reach of public accounts based on visible data, but you’ll never see another user’s exact dashboard figures.
How far back does Twitter analytics go? The native dashboard generally shows up to 28 days of historical data at a time, though you can switch between rolling date ranges. For longer historical retention, a third-party tool is needed.
Does checking my own analytics count as an impression on my posts? No. Your own views of your own posts are excluded from impression counts. You can refresh your own tweets all day without inflating the numbers.
Can I see who specifically viewed my profile? No, and be wary of any tool claiming otherwise. X provides aggregate profile visit counts only — never individual viewer identities.
The bottom line
The short version: for free, use the mobile app’s View post analytics on individual posts and keep a weekly spreadsheet. For paid, the $8/month Premium unlocks the full desktop dashboard with trends and demographics. For deeper analysis, go to a third-party tool.
And once you’ve got the data flowing, the real question is what to do with it. For a complete walkthrough of which metrics actually matter, what counts as a good engagement rate, and how to turn weekly pattern-spotting into posting decisions that grow the account, see our complete Twitter analytics guide.
For benchmarking your tweets against other accounts in your niche — something neither the native dashboard nor most third-party tools give you — that’s what we built tweetranking.com for.